Dashboard App
The Dashboard App provides access to all of your captured traffic with unique features including Per Page Traffic over Time, Table Views of Traffic, and several more common features such as referrer, device, and timezone.
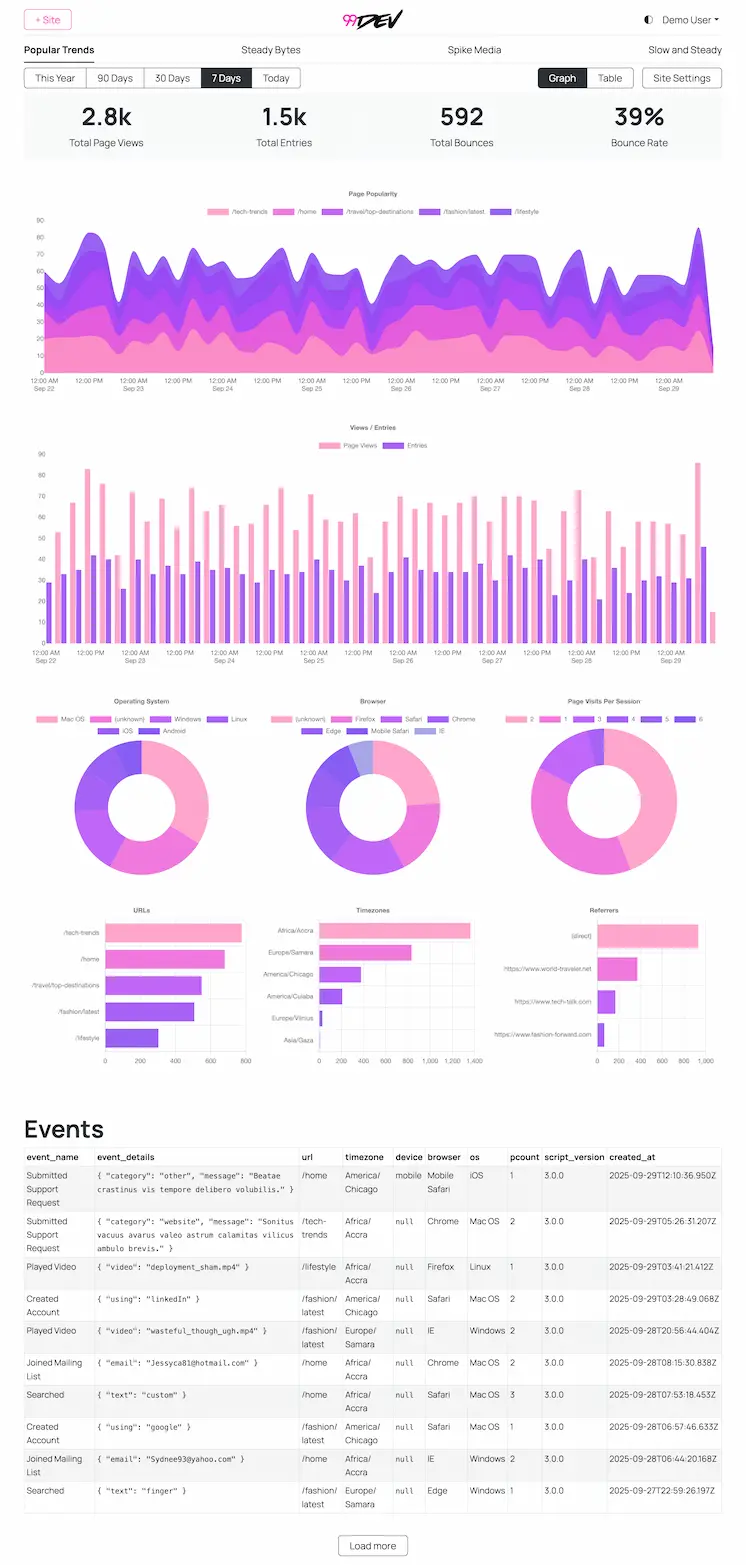
Page Views Over Time
View individual page traffic over time to understand which pages are most visited and when, visualized in a beautiful area chart.
Different Time Segments
Select the time segments you wish to view, either today, last 7 days, last 30 days, last 90 days, or so far this year.
Totals - Visits, Page Views, and Bounces
Across the top of the page, you’ll see a headline view of the total counts for visits, page views, and bounces.
Bounce Rate
See your Bounce Rate which is determined by the percentage of visits containing only 1 page view.
Referrer Tracking
Understand your traffic sources:
- Direct traffic
- Search engines
- Social media
- External links
UTM Campaign Tracking
Track your marketing attribution tags separately from browser referrers:
utm_source,utm_medium, andutm_campaignare visualized in dashboard chartsutm_termandutm_contentare captured and shown in the page views table- UTM data appears only when matching tagged visits are present in the selected date range
Pages Per Visit
See the total number of pages viewed during each visit to your website.
Custom Events
See a list of Custom Events your site has received and the JSON data included in each event.
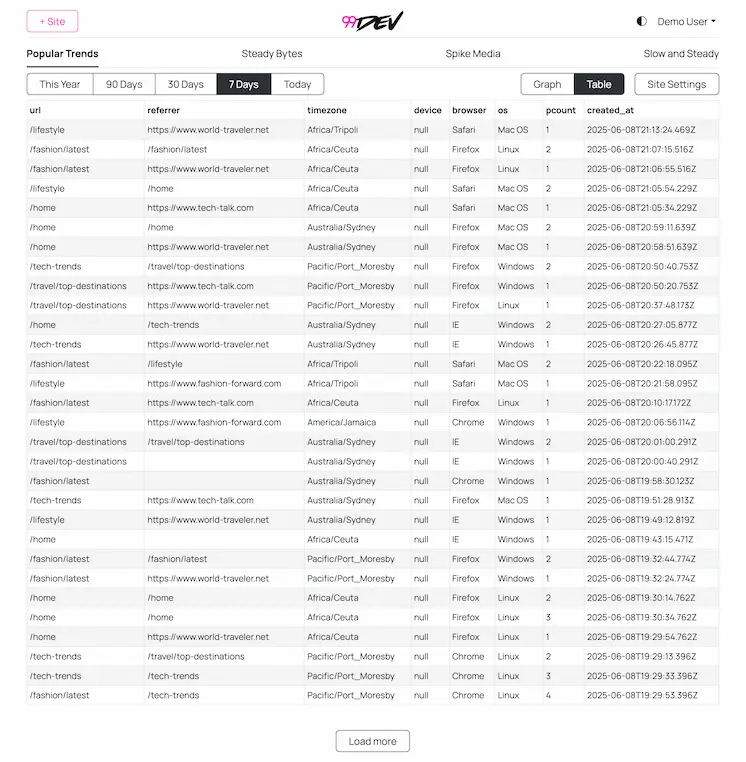
Table View
View a tabular list of each page view and it’s associated referrer, URL, timezone, etc.